Ingesting data to SQL Database
Ingested and processed data into SQL databases
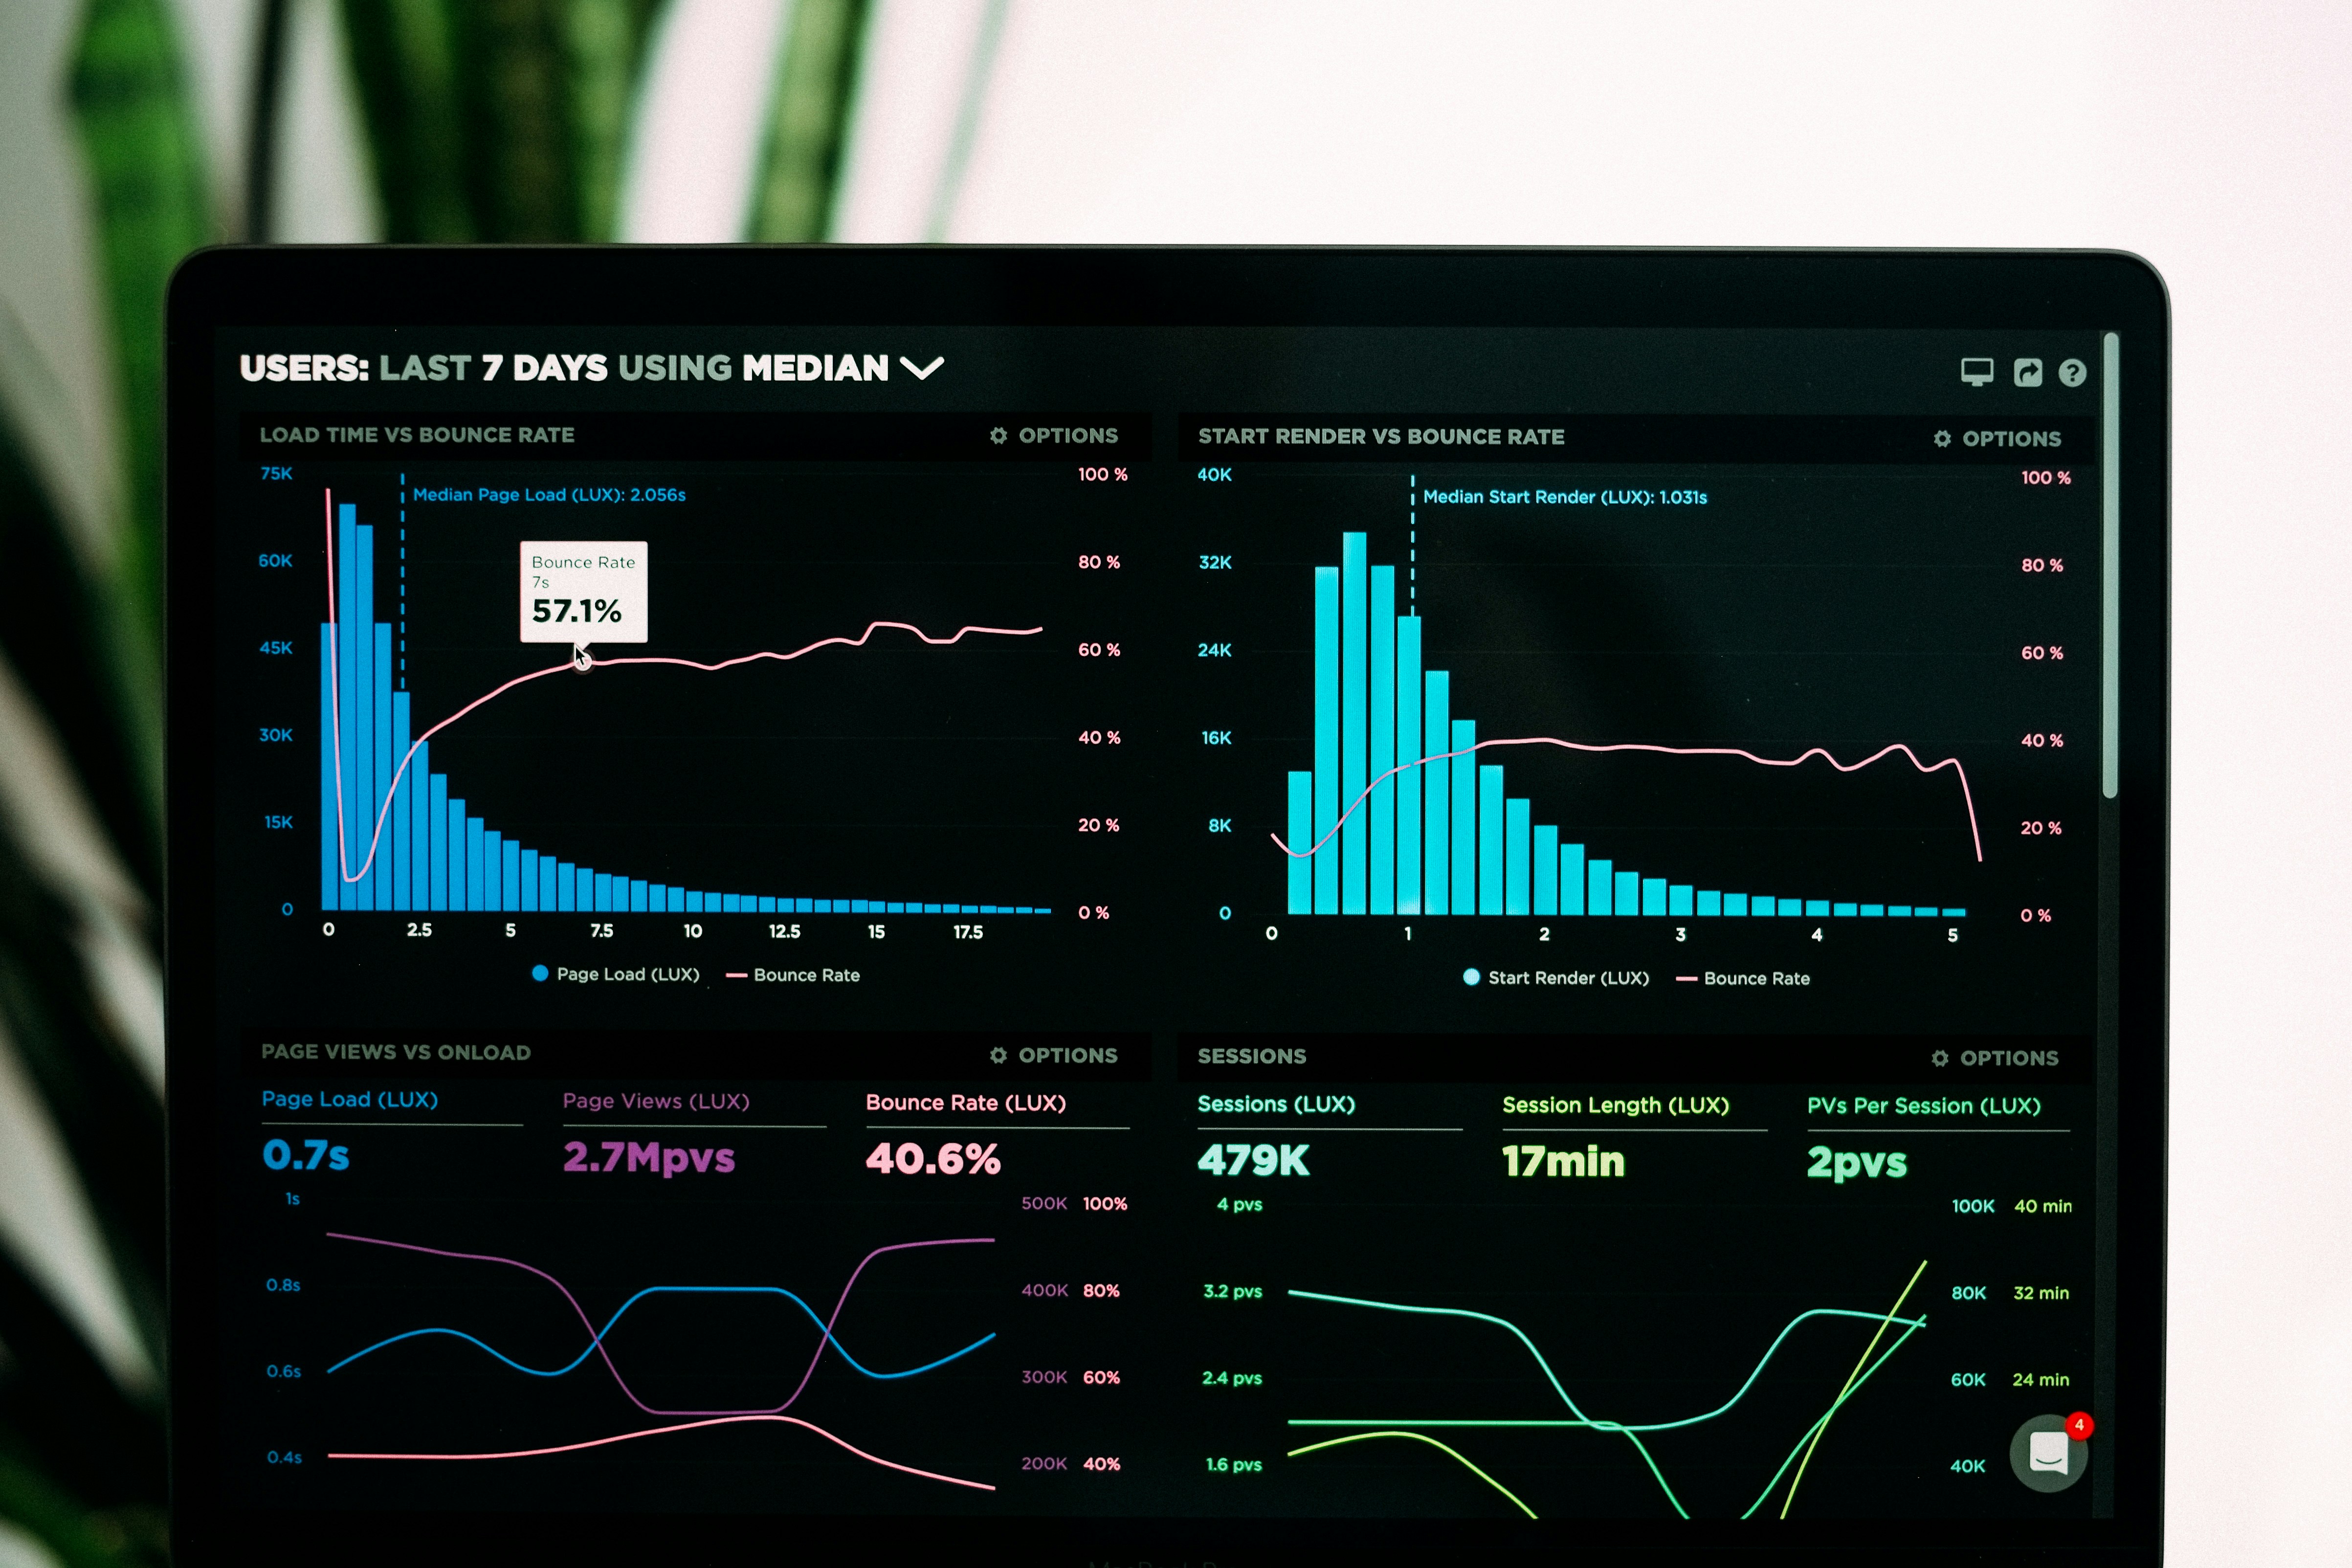
Exploratory Data Analysis

Performed EDA using statistical techniques and visualizations to identify trends and insights
View EDA CodeFilter Necessary Data

Post-EDA, refined the dataset by filtering and selecting key features and stored it back into the database
View Summary